For my senior capstone project, I led a team of 20 aerospace undergraduate students who worked with a team of NASA Goddard scientists and engineers to design a mission and rover for investigating permanently shadowed regions (PSRs) in the Lunar South Pole. Our goal was to search for water-ice using 3 bespoke instruments developed by the scientists. Below are my contributions to the project FLARE (Fleet for Lunar Autonomous Reconnaissance and Exploration).
Contribution
Summary
Sensor Suite
Contribution:
- Designed the sensor suite for autonomous inertial navigation with complementary components to reduce errors built up in pose estimation over time.
| Sensor Suite | Output | Use |
| Inertial Measurement Unit (IMU) | Accelerations & Angular Velocity | Position, velocity, and attitude estimation |
| Light Detection and Ranging (LiDAR) | Discrete return Intensity and X, Y, Z cords | Digital Elevation Map + Visual odometry |
| Hazard Cameras | Images | Detection of obstacles + Stereo vision |
| Star Tracker | Attitude | Correct attitude error build-up in IMU |
| Atomic Clock | Time | Assist star tracker + Radio ranging |
| Sun Sensor | Vector in the direction of the sun | THSiRU-G pointing + Solar array pointing |
| Wheel Encoders | Wheel rotations | Wheel speed and distance estimate |
Method:
- Compiled lists of sensors from different manufacturers, comparing important specifications using min-max normalization.
Result:
- Was able to provide the team with an initial SWaP estimate to begin designing the rover around.
- Increased accuracy in pose estimation while minimizing mass and power draw.
- Final sensor suite optimized for mission design.
Global Path Planning Algorithm
Contribution:
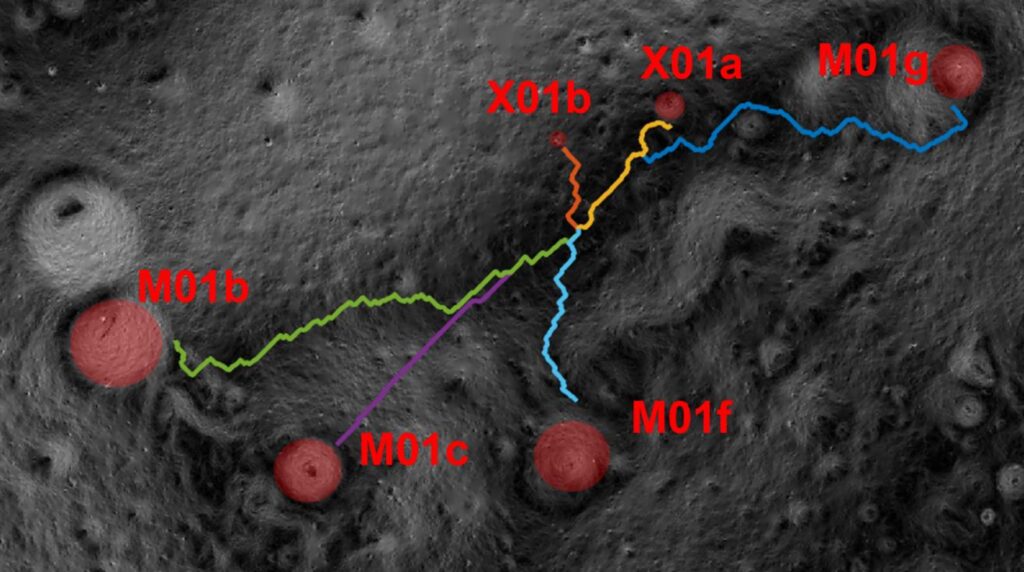
- Developed a global path-planning algorithm that took elevation and slope data from LOLA to find the optimal path between waypoints.
Method:
- Developed a MATLAB algorithm to transform geospatial data to a nodal map with edge weights based on the distance between the nodes and the difference in slope.
- Used MATLAB shortest_path( ) algorithm (Dijkstra’s) to find the optimal path between nodes.
- Iterated through prioritizing distance vs slope weight to find the best path from start to goal.
Result:
- Minimize max slope encountered by 10%, average slope encountered by 34%, and total distance traveled by 20%.
- Provided Guidance, Navigation, and Control sub-team with a basis for local path planning.
Mission Design
Contribution:
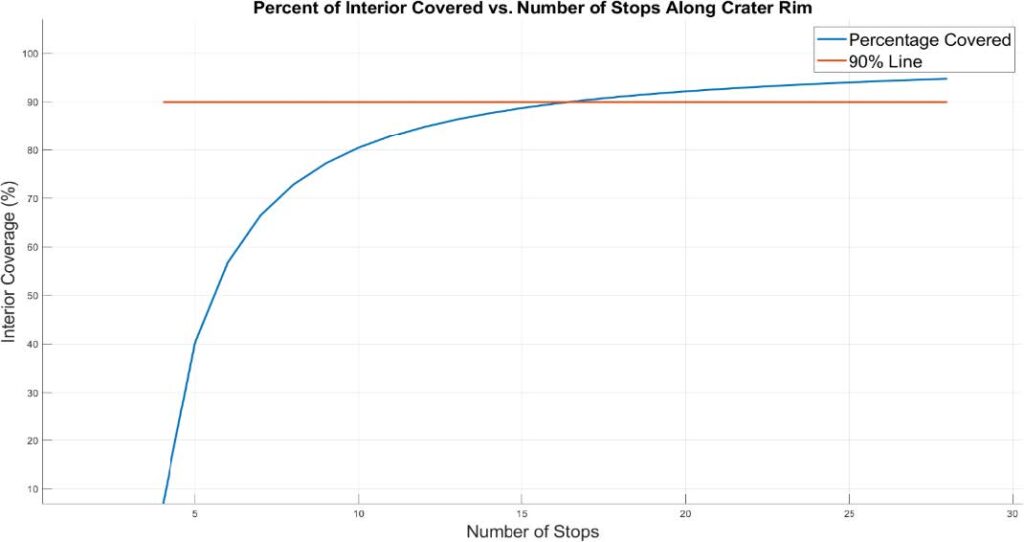
- Established mission requirements to guarantee 90% interior coverage of a crater using the TENS instrument.
- Planned the rover mission, inside and out of permanently shadowed regions, modeling systems to determine a timeline and science data return estimation.
Method:
- Used TENS instrument FOV to determine the required number of stops along any crater rim for 90% interior coverage using simplified geometry.
- Modeled rover driving time, charge level, charge time, communication time, and time to take measurements to maximize the number of measurements for each rover’s mission.
- Presented multiple mission options based on projected science data return, crater traversability, and the relation between competing scientific interest measurement time.
Result:
- Met all mission requirements with high confidence in science return.
- The projected science data return was 3 times more for each rover than the requested data return by the NASA scientists.
- Commended by NASA scientists and engineers for delivering comprehensive CONOPS compared to prior years.
Simulation
Contribution:
- Created a Lunar pseudo-environment for locomotion testing.
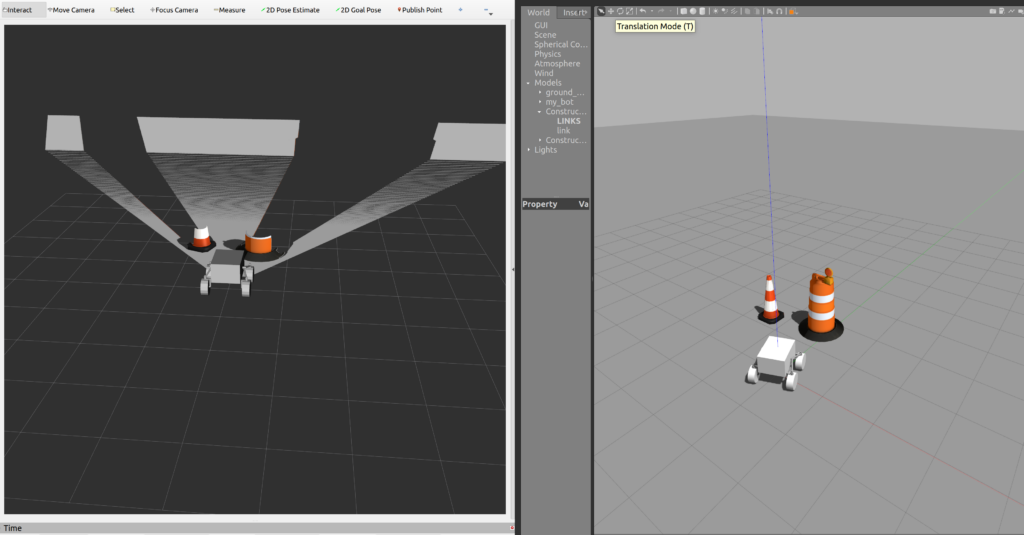
- Simulated the rover’s vision in Gazebo Simulator.
- Simulating rover driving (what I am currently working on).
Method:
- Utilized Blender to create a mesh and spread expected Lunar rock obstacles over the surface.
- Simulated rover vision using Gazebo Depth Cameras and Velodyne VLP-16.
Result:
- While I was not able to officially present results, I continued to develop software for the rover’s navigation, guidance, and control.
- Read more
Comprehensive Review
Instruments
Thermal and Epithermal Neutron Spectrometer (TENS)
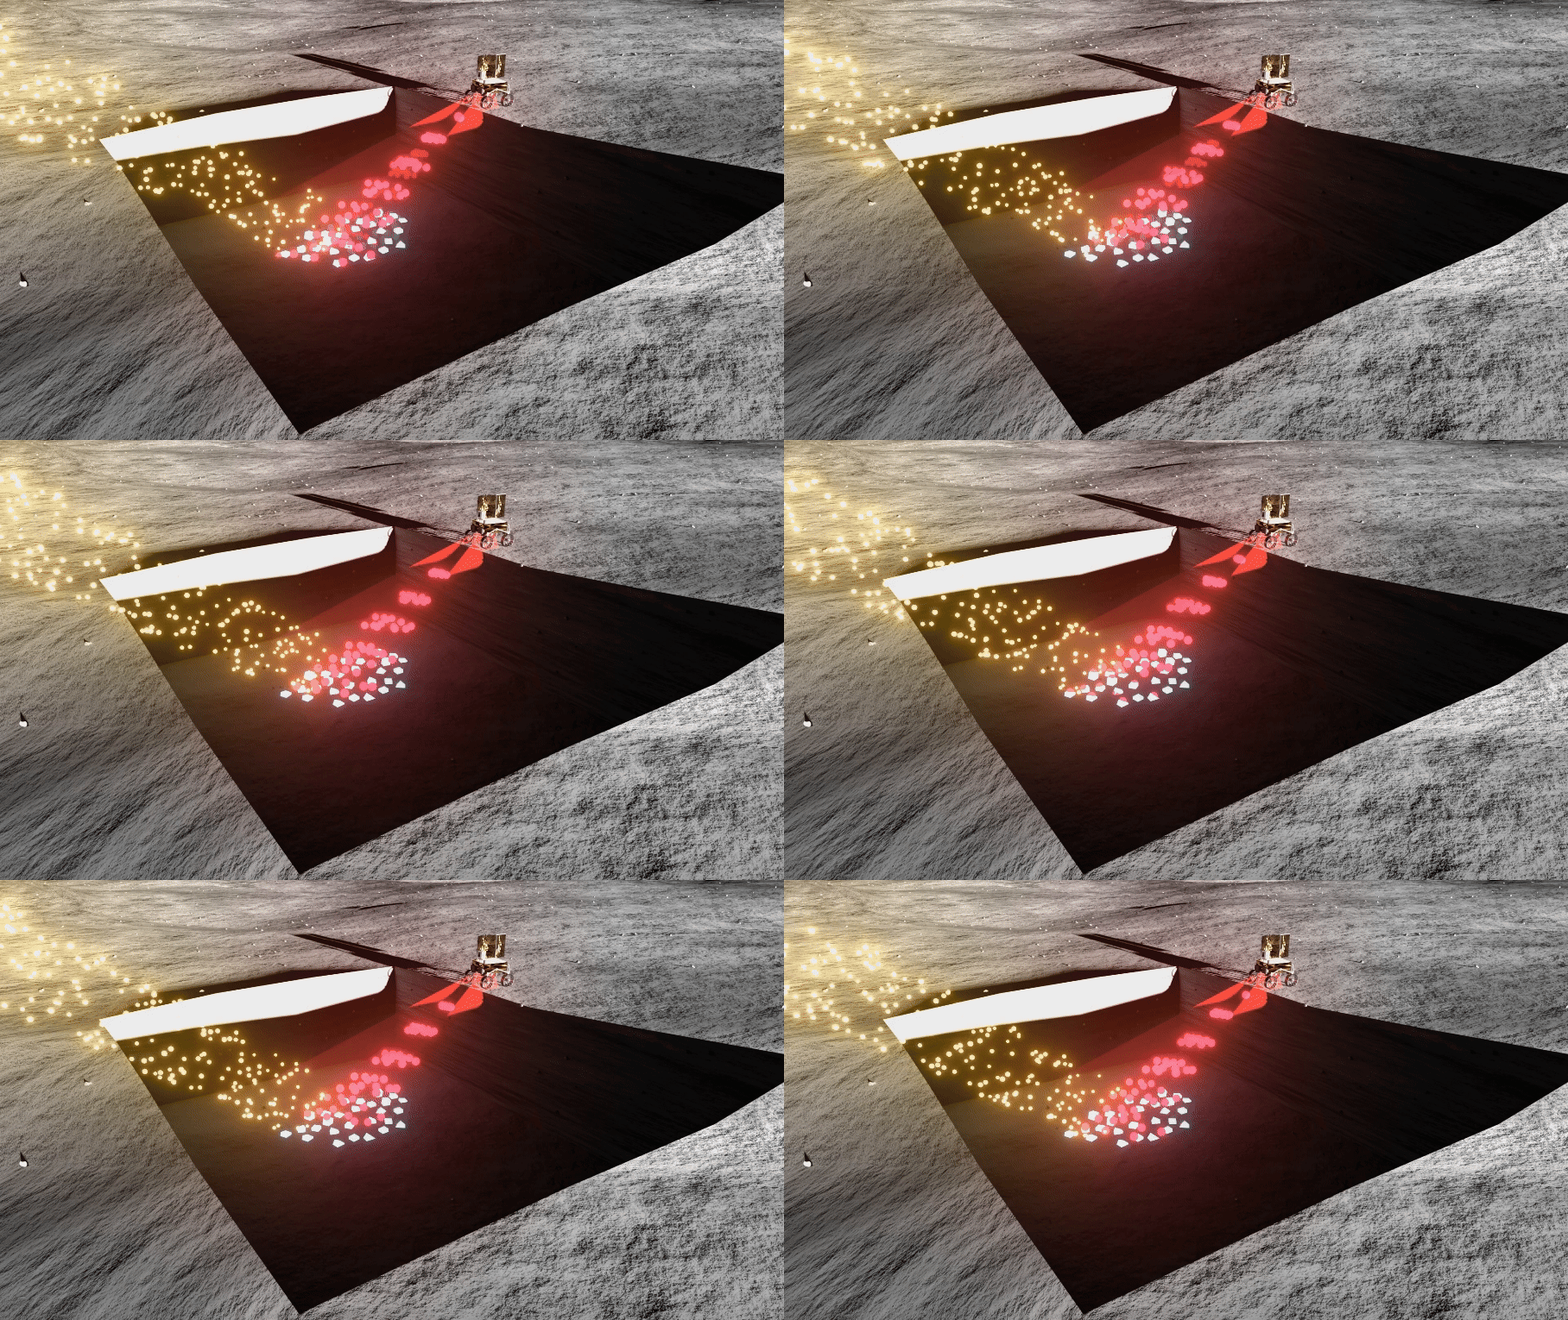
Neutrons are ejected when galactic cosmic rays (GCRs) interact with Lunar regolith. Subsurface water presence moderates these neutrons, which is measured by TENS. The yellow particles represent GCRs, the blue blocks represent subsurface water, and the red particles are the thermal and epithermal neutrons.
Goal: Model the interior of a PSR.
Terahertz Heterodyne Spectrometer for in-situ Resource Utilization – Surface (THSiRU-S)
A close-range spectrometer probe used to measure surface water content. The instrument will be lowered down onto the surface. The blue blocks represent surface water-ice and the red is the measurement field of view.
Goal: Radial measurement around the PSR and cross-section through the basin.
Terahertz Heterodyne Spectrometer for in-situ Resource Utilization – Gaseous (THSiRU-G)
Spectrometer for exospheric measurements using the sun as a backlight. The goal is to capture any water vapor exiting the PSR by looking across the basin. The globe in the distance is the sun, the beam is the field of view of the instrument, the dark area is the PSR and the gas moving out is possible water vapor.
Goal: Capture the cycle of water around PSRs.

Sensor Suite
As of today, the Moon does not have a global position system for surface navigation, so our rovers would need to be able to navigate on the surface without aid. We built our navigation around inertial navigation and integrated complementary components to determine the position and attitude accurately.
| Sensor Suite | Output | Use |
| Inertial Measurement Unit (IMU) | Accelerations & Angular Velocity | Position, velocity, and attitude estimation |
| Light Detection and Ranging (LiDAR) | Discrete return Intensity and X, Y, Z cords | Digital Elevation Map + Visual odometry |
| Hazard Cameras | Images | Detection of obstacles + Stereo vision |
| Star Tracker | Attitude | Correct attitude error build-up in IMU |
| Atomic Clock | Time | Assist star tracker + Radio ranging |
| Sun Sensor | Vector in the direction of the sun | THSiRU-G pointing + Solar array pointing |
| Wheel Encoders | Wheel rotations | Wheel speed and distance estimate |
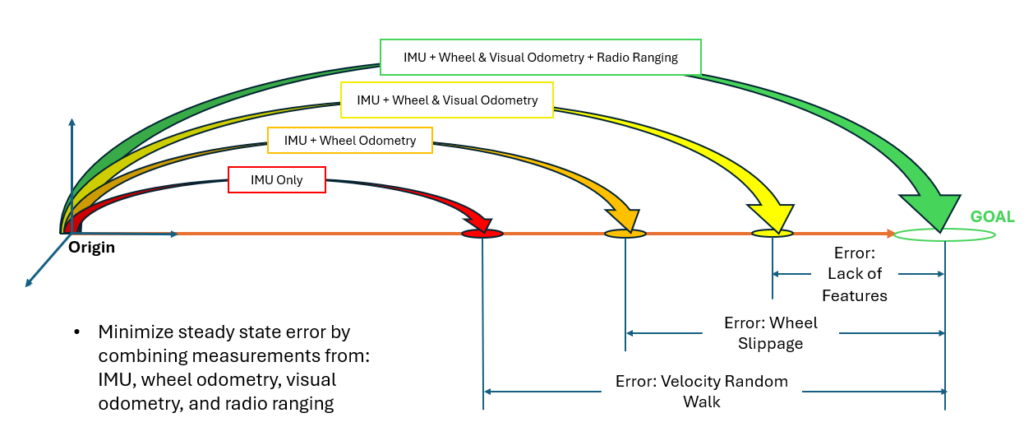
The exact sensor suite our team designed around was completed through trade studies of multiple sensor brands and types. The specifications of each instrument were compared using min-max normalization resulting in an optimized sensor suite based on our mission needs.
Global Path Plan
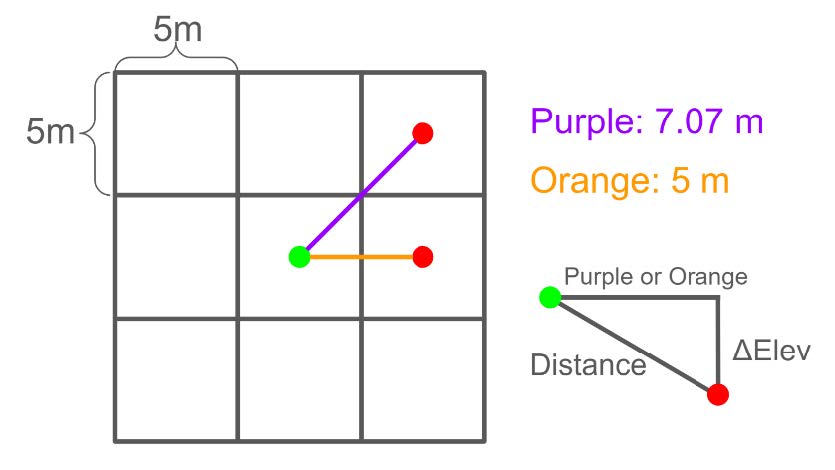
To get the rovers from the landing zone to each of the PSRs of interest I developed a global path plan using LOLA elevation and slope data for Site 001. Each pixel describes a 5 square meter area and is associated with either an elevation in meters or a slope in degrees.
I developed a MATLAB algorithm to take the geospatial raster files (.tif) and convert them to a nodal map where each edge weight was a weighted balance between distance and slope. The distance was calculated using the image below to the right and the slope was the difference in slope between the two nodes. Nodes that exceeded the rover’s max slope did not have edges connected to them.
![]()
I then used MATLAB’s shortestpath( ) function to find the path with the lowest weight between the start and end nodes. I iterated through the possible weights for both distance and slope to find the optimal weights for each of the rover’s paths. Ultimately, I was able to reduce the maximum slope encountered by 10%, the average slope encountered by 34%, and the total distance traveled by 20%.
Mission Design
Determining the timeline and data return of the mission involved balancing the expectations of each scientist’s instrument and the mission requirements. To start the requirements of the science mission are listed below:
| Requirements |
|---|
| The rover(s) shall be able to take 16 measurements along the crater rim |
| The rover(s) shall take 3 THiSIRU-G and THiSIRU-S measurements per Earth Day prior to entering a PSR |
| The rover(s) shall take at least one 6-hour TENS measurement within a PSR |
| The rover(s) shall take 3 THiSIRU-G and THiSIRU-S measurements per Earth Day before entering a PSR |
| The rover(s) shall take a Lunar dusk measurement with THiSIRU-G |
Outside the PSR
A baseline measurement is conducted to model the PSR before entering. The rovers will use the TENS instrument to peer into the crater measuring subsurface water-ice concentrations. The necessary number of stops along the crater rim is controlled by the field of view of the TENS instrument.
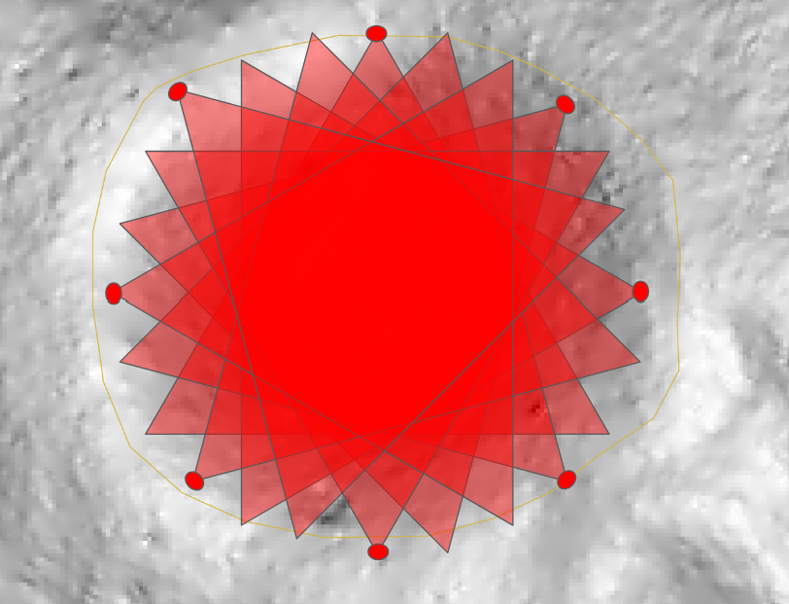
Using the known field of view of 60 degrees and geometry we can determine how the area coverage grows with subsequent measurements and plot the interior area covered. The figure below shows diminishing returns after 16 stops, defining our mission requirement for 16 stops. This guarantees an interior coverage of at least 90%.
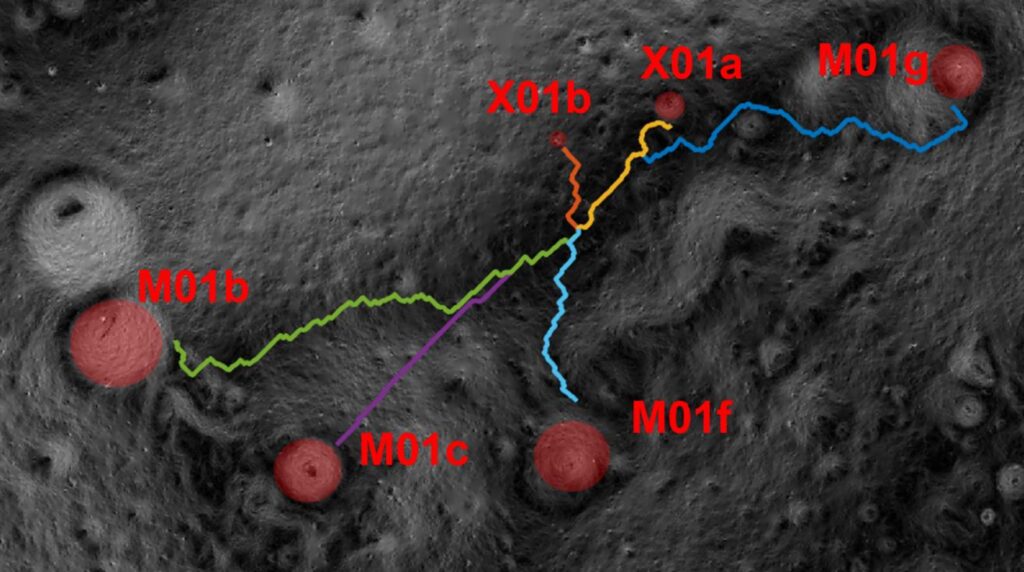
Microsoft Excel was used to model each rover’s systems; considering drive time between measurement positions, battery level, charge time, measurement time, and communication time. Each PSR was uniquely designed to maximize the number of measurements given the time left in the mission after arriving at the PSR while meeting the requirements stated above. An example mission around PSR M01b is shown below.
| Site | Measurement Time |
|---|---|
| 13a | 6-hour TENS + 30-minute THiSIRU-G + 5-minute THiSIRU-S |
| 13b (10 meters away from 13a) | 30-minute THiSIRU-G + 5-minute THiSIRU-S |
| 13c (10 meters away from 13b) | 30-minute THiSIRU-G + 5-minute THiSIRU-S |
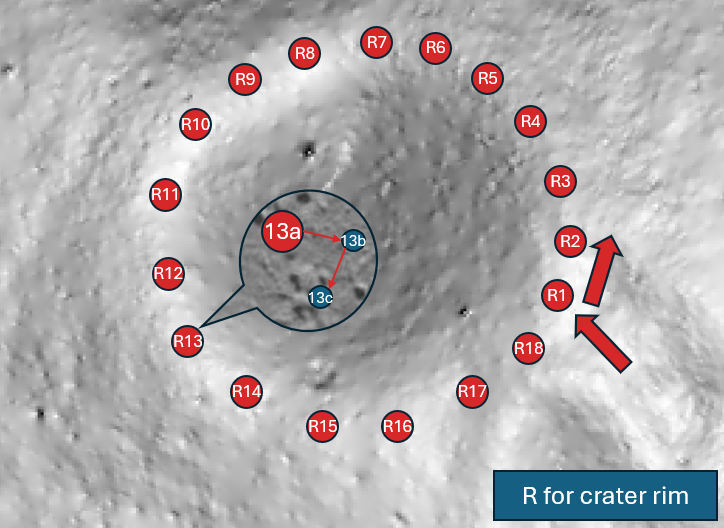
From this study, we can determine the data return before entering the PSR. The estimate exceeded the initial expectations of the NASA scientists by three times.
Inside the PSR
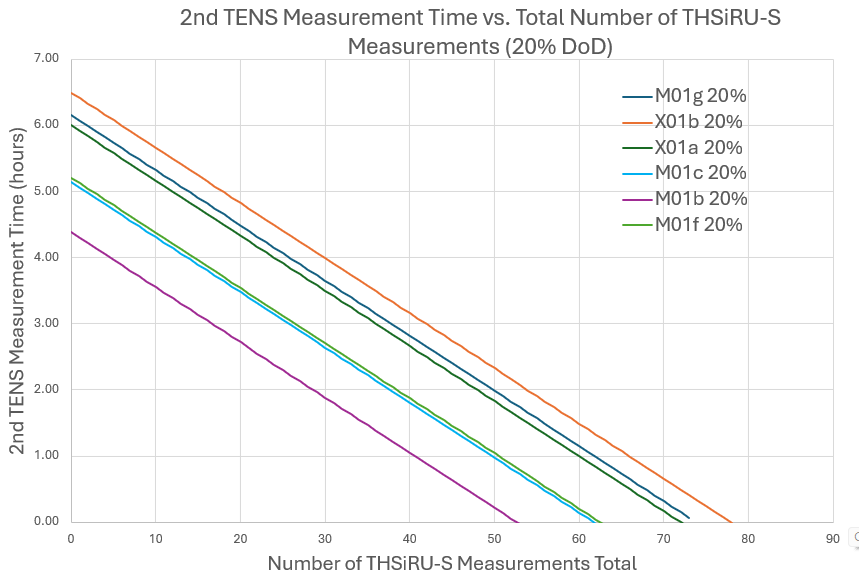
The goal of traveling into the PSR is to measure surface and subsurface regolith for water-ice concentrations and develop a cross-section of each PSR. The inherent challenge to traveling into PSRs is the extremely low temperatures at 40K-60K and the inability to recharge the rovers, making the system reliant on onboard battery storage. With the design, the rovers have ~15-18 hours within the PSR. Two options are presented given the rovers must take at minimum one 6-hour TENS measurement, shown in the figure below.

One option is to take one 6-hour TENS measurement filled in with THSiRU-S measurements for the rest of the time. The second option is to take a second TENS measurement for a lesser time balancing how many THSiRU-S measurements can be taken after. An analysis of the confidence of measurement for a TENS measurement that is less than 6 hours needs to be weighed in on whether a second measurement is worthwhile.
A Lunar dusk measurement with THSiRU-G is required, as the sun will be passing through the most amount of exosphere. To decide whether a rover should enter the PSR before Lunar dusk, to maximize measurement opportunities but risk missing Lunar dusk, is based on PSR traversability and projected science density return. The analysis for each PSR is shown below.
| PSR | Max Slope in PSR (deg) | Average Slope in PSR (deg) | Number of THSiRU-S Measurements Given One TENS | Normalized Value | Enter before Lunar Dusk |
|---|---|---|---|---|---|
| Weight | 0.5 | 0.2 | 0.3 | 1 | – |
| M01g | 24 | 9 | 65 | 0.61 | Yes |
| X01b | 13 | 10 | 77 | 00.03 | Yes |
| X01a | 19 | 10 | 72 | 0.34 | Yes |
| M01c | 24 | 14 | 61 | 0.80 | No |
| M01b | 25 | 16 | 53 | 1.00 | No |
| M01f | 24 | 12 | 62 | 0.73 | No |
Simulation
Environment
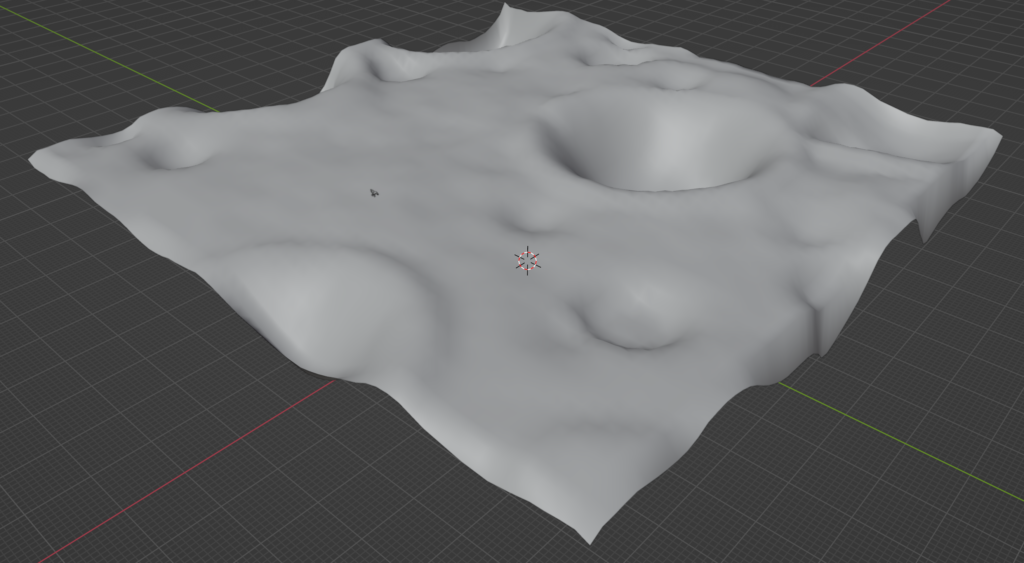
To begin simulating the rover’s navigation, guidance, and control a simulation environment was developed in Gazebo Simulator to mimic the Lunar surface. Originally, I converted the Site 001 LDEM data into a Gazebo simulator with added obstacles, but due to the resolution being too large to simulate rover-sized obstacles I decided to make a pseudo-environment. Since my method for transitioning the file was not done prior I will link a PDF document that explains the steps I took to import it to Gazebo for others to use.
To make the pseudo-Lunar environment generally follow these two tutorials. Together they will create a Lunar environment with obstacles.
Four Wheel Steering Control
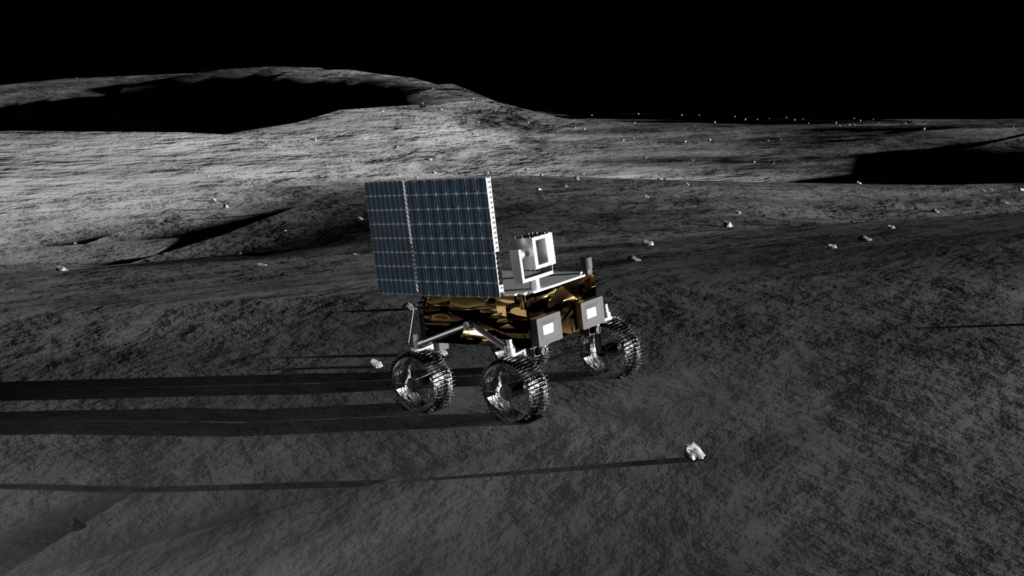
Our rover is equipped with four wheel steering, where each wheel can independently turn 360 degrees. This enables the rover to have greater steering control and move in abnormal ways compared to daily life driving. The three main driving capabilities are out-of-phase steering, in-phase steering, and turn in place.
- Out of phase steering, is much like the Ackerman steering of a car, but the back wheels rotate the opposite direction of the front wheels, rotating the back of the rover along the turning arc. Resulting in a tighter turn radius.
2. In-phase steering, is when the wheels rotate the same direction. The rover will translate with the wheels but will not rotate. This maneuver is often referred to as crab walking.
3. Turn in place, is done when the wheels are rotated to be tangent to the radius of a circle the 4 wheels create. This rotates the rover without translating in any direction.
Sensor Suite Simulation
I simulated the rover’s LiDAR system by modifying the specifications to a Velodyne VLP-16 to loosely match the space-rated LiDAR system our team used that is unreleased.
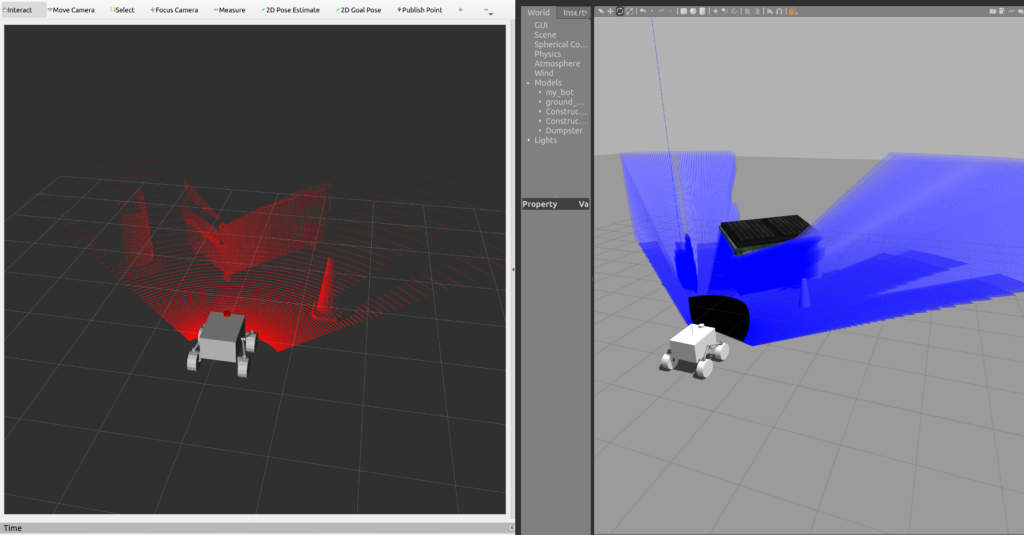
To fill in the blind spots of the LiDAR I included high FOV cameras called hazcams. These cameras have overlapping vision which adds additional stereo vision for navigation around targets located near the wheels. There are 2 cameras on the front of the rover and back, enabling bi-directional driving.
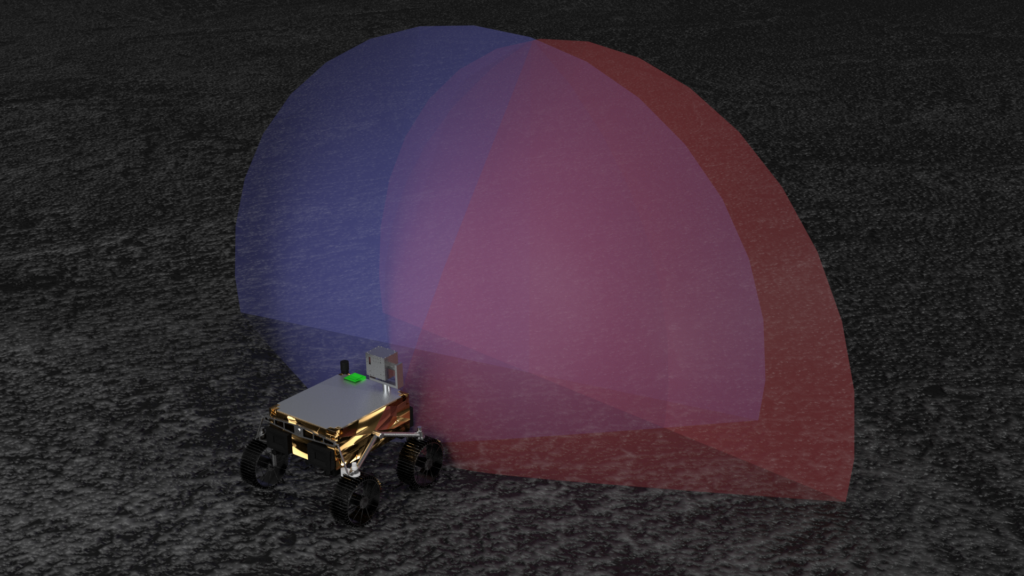
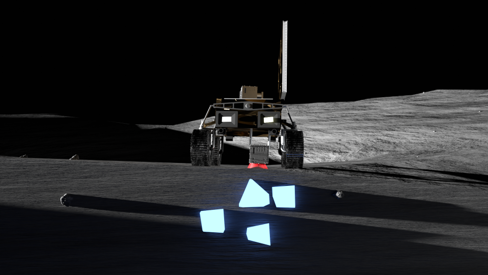
Simulating the stereo vision aspect of these cameras I used Gazebo depth cameras. Below is an image showing the depth cloud created by stereo vision in front of the rover’s wheels.
Sensor Fusion
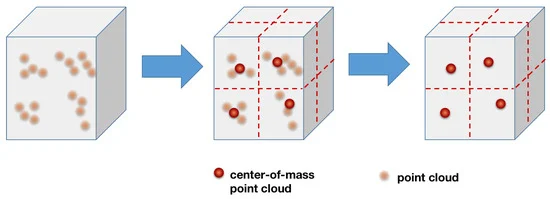
With the output of multiple point clouds from the vision system, a few steps need to be made to create a final point cloud for navigation. To start, transformations between the two vision systems need to be established to place them in the same reference frame. This can be done using the known distances between the stereo camera and LiDAR instruments. The point clouds would then need to be fused. Given the sensor overlap, there will be variable density and noise, so algorithms to downsample the point cloud, filter the noise, and normalize the values will need to be included.
